

PSU Climate Battery Study 2018-2019 Summary
Impetus
The climate battery greenhouse is a complex thing to study. As of the date of writing this, I’ve been operating our climate battery greenhouses for a couple of years and have a good pragmatic feel for how the houses operate. However, I wanted to be able to quantify the amount of heating or cooling the systems actually provide and do an apples-to-apples comparison between the two to determine how to best construct future systems.
In the fall of 2018, I approached Penn State Harrisburg’s mechanical engineering department with a capstone project idea for a group of their engineering students in their senior year. From that initial contact a group of four students: Brandon, Nick, Mark, and Chris, signed on to work with me throughout the school year and quickly got to work determining how to best measure and analyze the heat transfer occurring in the houses.

Gray House Tubing Layout
Study Goals
While the study was complex (you know, thermodynamics and all), the goals were rather straightforward.
Goal #1: Quantify heat transfer in the two existing climate battery greenhouses
Goal #2: Determine and implement improvements to the existing system or make suggestions for future systems

Blue House Tubing Layout
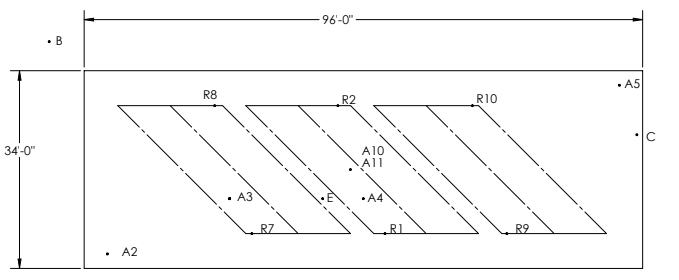
Gray House Sensor Layout - Final Version
Data Collection
Data was collected from 30+ sensors placed strategically throughout both greenhouses. Sensors were placed to measure:
Air temperature at various heights within both houses
Ground temperature at various depths and positions both inside and outside the greenhouses
Inlets and outlets of the climate battery system
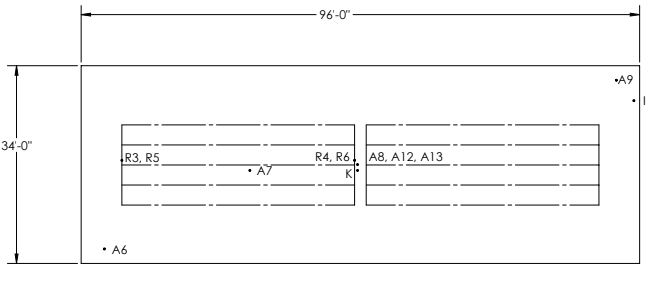
Blue House Sensor Layout - Final Version
Sensors utilized were the inexpensive Elitech RC-4 and Elitech RC-4HC with the ability to measure temperature via probes. Sensors were extended as necessary and calibrated to record consistently, and were all set to record data every 15 minutes throughout the course of the project. Data was pulled from the sensors weekly and they were reset. Several of the sensors were moved throughout the project as the need to analyze different data came up.
Data Analysis
The team introduced me to psychrometric charts, a way to measure the energy content (enthalpy) of a specific volume of air. Therefore, by analyzing the inlet and outlet temperatures in the risers along with airspeed, we can calculate how much the system is heating and cooling using psychrometrics. Their analysis of data measured heat transfer averaged out over many data points. The heat transfer in this system is not as constant as, for instance, a propane heater with a rated BTU output, but the data below gives you an idea as to the output of the system:
Note: These numbers seem to be off, especially the blue house. The gray house numbers seem to be semi-accurate. Stay tuned for PSU Study ‘19/’20 numbers.
Gray House Heat Transfer Summary
Heating Mode: 103,000 BTU
Cooling Mode: 153,000 BTU
Blue House Heat Transfer Summary
Heating Mode: 242,000 BTU
Cooling Mode: 992,000 BTU
Efficiency Calculated
Using the calculated BTU output of the system along with the energy consumption of the system, as well as a calculated efficiency of the system (this piece I admit I don’t quite understand), the team was able to calculate the coefficient of performance (COP) of each greenhouse. My calculation of COP would have been different, as in my understanding it’s simply a ratio of the energy produced to the energy consumed. I believe they averaged both heating and cooling to provide a single COP:
Gray House COP: 32.69
Blue House COP: 6.81
For comparison’s sake, a current ground-loop geothermal system, the most efficient commercially available system COP-wise, has a COP in the range of 3-6 (higher is better). While it may be too early to draw definitive conclusions, the climate battery definitely demonstrates extreme promise in terms of energy efficiency.
Suggested or Implemented Improvements
Laminar versus Turbulent Airflow
The system should achieve turbulent airflow (as opposed to laminar flow) in the heat transfer tubing to best facilitate heat transfer. The gray house achieved this flow due to higher CFM fans, while the blue house did not. However, the blue house was still effective, especially in cooling mode, so more work needs to be done there.
Airflow Evenness - Baffles
Through the course of the study, the team set out to increase performance of the gray house, since it has accessible manifolds. It was determined that the air transfer tubing setup was not conducive to even airflow across all of the tubing runs on a particular manifold. As expected, the tubing at the far end of the manifold receives faster airflow than the tubing at the near end closest to the fan. As a result of the uneven airflow, the heat doesn’t transfer as effectively to the soil as it otherwise could.
The team installed baffles in the tubing in an attempt to better even-out airflow across all of the tubing and the results are documented in the linked report below.
Airflow Increase - Booster Fans
Currently both houses orient fans in a “push” mode, where air is pushed through underground tubing. This works well but there are instances where a second fan at the exit might serve to both boost airflow (causing a greater turbulent flow) and total air volume moved through the system. The results are documented in the report linked below.
Mini Greenhouse Test
To test some ideas, the team installed a mini climate battery system over top of a 7’x15’ greenhouse kit that we used for plant starts. They did a side-by-side comparison of a soil-contact tubing system with a rock bed system. Results are in the report linked below.
Second Layer of Plastic
It became obvious after some study that the second layer of plastic in the blue house was a necessity given the almost complete lack of insulation of just a single layer of plastic. A second layer of plastic will be added during the 2019 growing season.
Insulating the Climate Battery
Some thought was given as to the value of insulation in the soil around the climate battery. Where space is limited and the climate battery takes up the entire footprint in the soil, this may be advisable. However, the team found it sufficient that in the blue house we insulated the battery with four to six feet of soil on every side within the footprint of the house. This may mean that the soil around the edges is cooler than the inside portion but could be a cost-saving measure (and a plus if you don’t like the idea of insulation material in your soil footprint).
Areas for Additional Study
Balanced Ducting
Through the study of the gray house, it was readily determined that the airflow through the heat-transfer tubing was not nearly as even as desired, with the air in some of the tubes moving at up to four times the speed of the others. This difference between the sets of tubing means that the effective interface between the soil and the air could be greatly improved if the airflow were to be evened out. Future projects will look at ways to better balance airflow between all of the tubing in the design of the riser and manifold systems.
Scalability of System
The system shows some promise of being able to scale. Unanswered questions remain as to the overall capacity of the soil to retain and deliver heat and how best to scale a climate battery system to match the heating and cooling needs of a structure.
Greenhouse System Controller
Simple thermostats with a single stage of heating and cooling are currently utilized in both of our houses and run based off of air temperature readings. A more complex controller could be utilized that would factor in soil temperature as well as other significant information in decisions on whether or not to engage the system.
Final Report and Data Downloads
Linked here are the final report PDFs, Powerpoints, and relevant data points. Contact Us if you’re interested in any other documents for further study, including all data points collected during the study (a rather large file), or any of the diagrams produced.
The climate battery calculator provided below is an initial attempt to design a climate battery’s heat transfer tubing needs based off of heat loss and desired temperature. It should be noted as an additional guide rather than a go-to reference at this stage in the study of climate batteries, so please use at your own risk and do your own research prior to installing a system like this.
Final Thoughts
The team of PSU students did an excellent job at taking the first steps toward understanding how climate batteries work and quantifying the heating and cooling provided by this type of system. Based on their data and conclusions, I see no other commercially-available system that is as energy-efficient at delivering heating and cooling. This shows definite promise.
That said, there is much to still learn, discover, and improve prior to commercial adoption of this type of system. Our hope is to continue our relationship with PSU and possibly other universities to study and improve upon this method of heating and cooling. If you’re interested in partnering with us, please Contact Us and let us know the ways in which you’d like to help.